Notes
Field notes: the week Golden Week emptied every yard
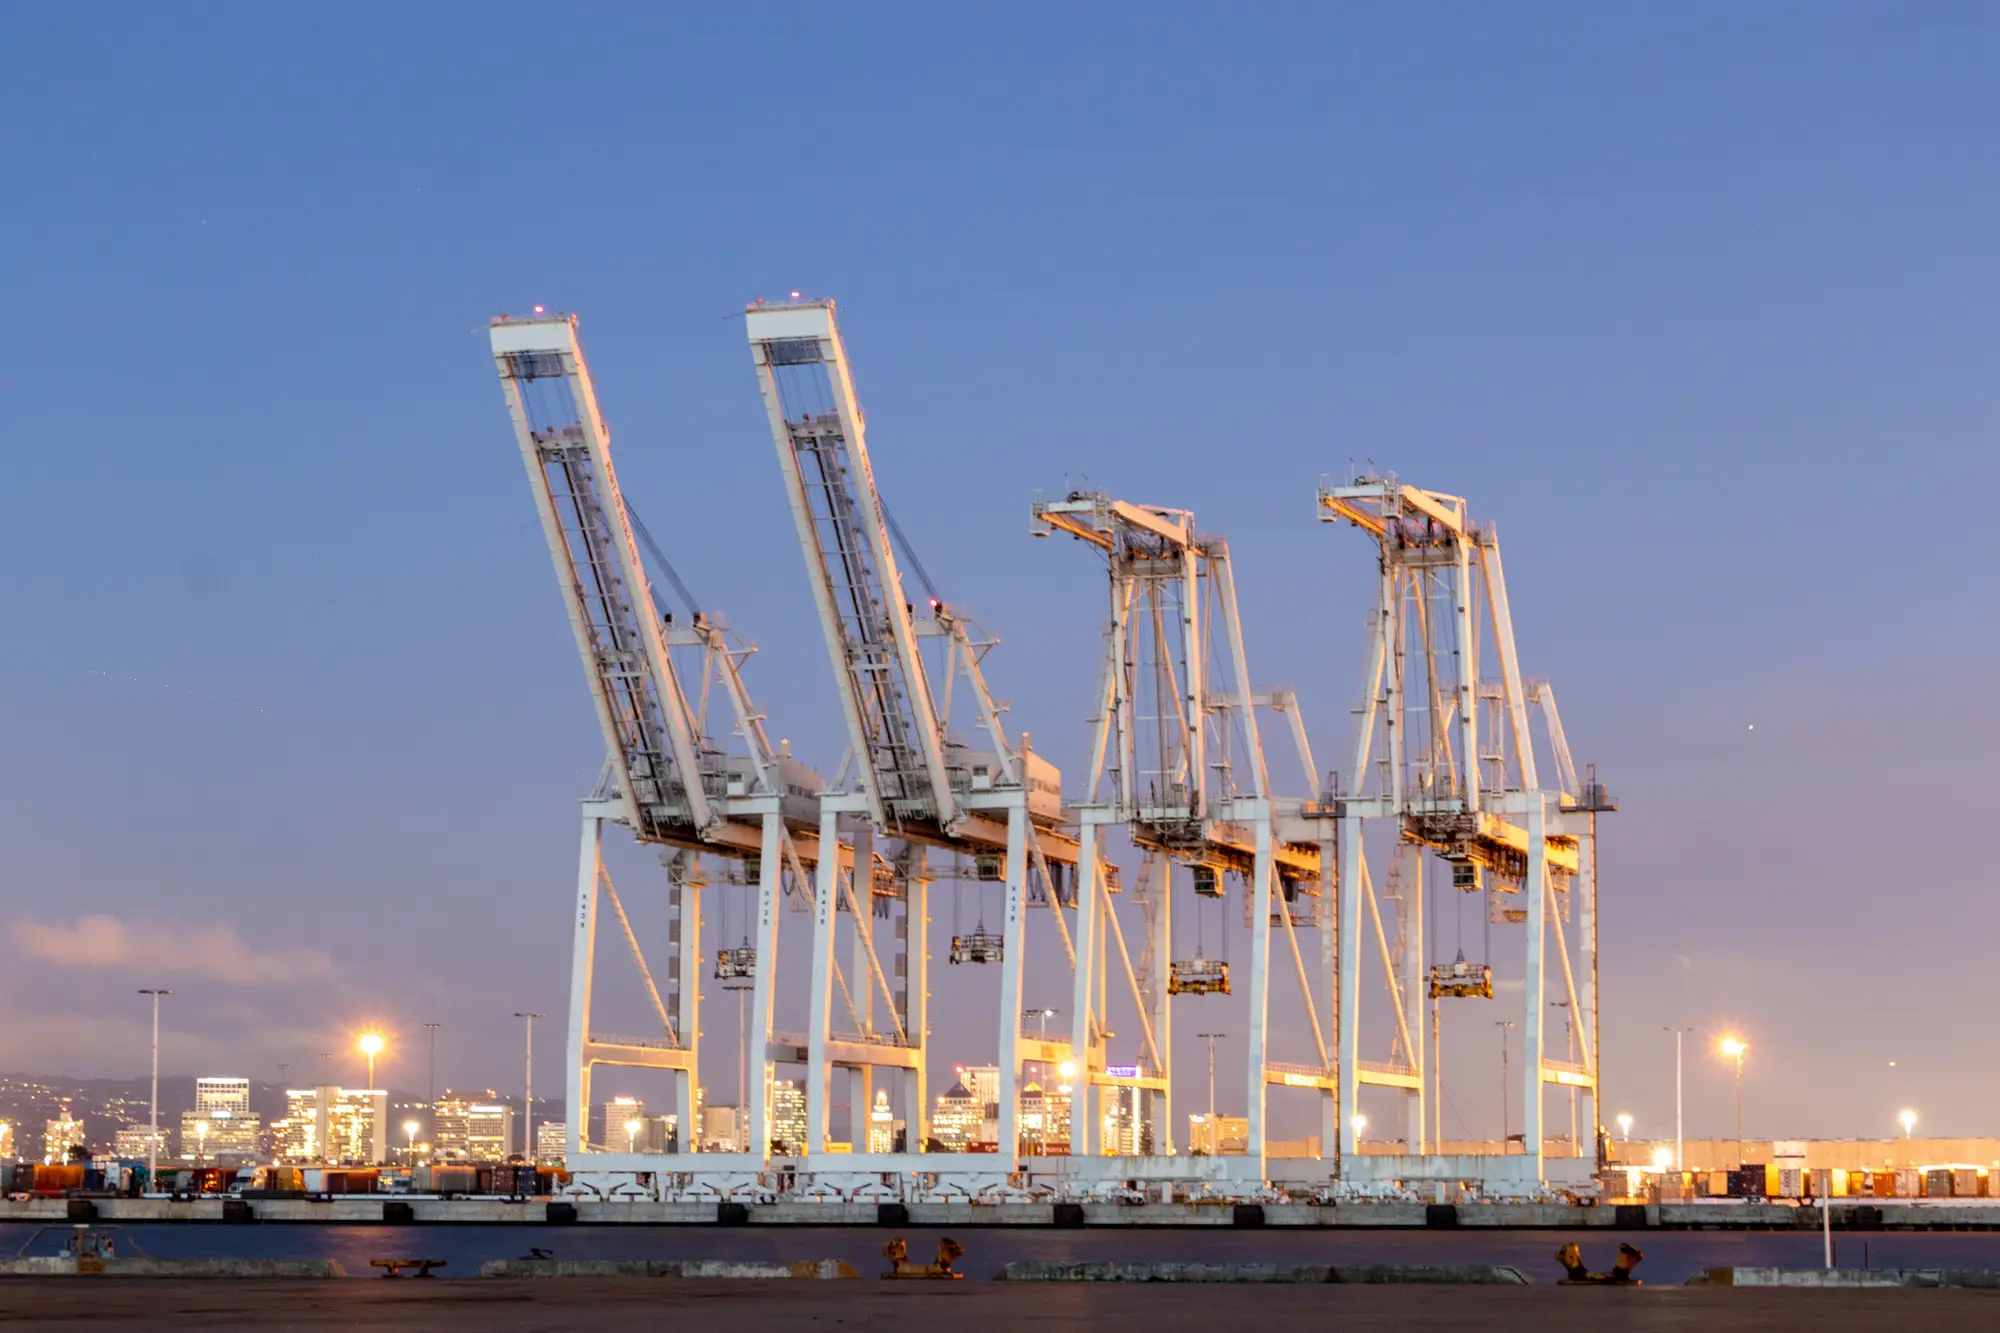
Golden Week is printed on the calendar months in advance. Every factory floor in the Pearl River Delta knows it's coming, and every freight desk has lived through it at least a dozen times. So it's a little strange how often the week still manages to catch a book of positions flat-footed.
This year ran true to form. The ten days before October 1 saw the usual scramble: shippers front-loading cargo, yards at Yantian and Ningbo-Zhoushan filling up faster than the vessel schedule could clear them, and spot rates on the transpacific ticking up on nothing more than the knowledge that production was about to stop. Then it stopped. Eight days where the only container movement in a huge stretch of coastal China was trucks idling and gate activity dropping to something close to zero. Anyone watching yard occupancy could see it happening in real time, stack counts falling off a cliff at the exact terminals that had been jammed a week earlier.
The restart trips desks up more than the shutdown does, because it's so uneven. Factories don't all flip back on October 9th at the same pace. Some lines return to full output within two or three days, because the order book never let up. Others ease back in over a week, clearing a backlog of partially finished goods before export volumes normalize.
That unevenness shows up as a second, messier wave: yard stacks rebuilding in fits and starts, vessel calls bunching up as carriers try to recover blanked sailings, and anchorage queues at Qingdao and Shanghai swelling about ten days after the holiday ends rather than right away. A desk pricing capacity or positioning equipment off a model that assumes a clean on/off switch reads that second wave as noise. It's the actual shape of the recovery, visible at the yard well before it shows up anywhere else.
The data most desks lean on for this window is exactly the wrong data. Customs releases on China's September and October trade figures land four to six weeks after the fact, long after the window where the information would have changed a hedge or a booking decision. AIS gives vessel positions, which is useful for knowing where a ship is, but it tells you nothing about what's sitting in the yard waiting to be loaded or how deep the backlog runs at the terminal. A ship sailing half-empty off Yantian looks the same on AIS as a ship sailing full. The difference is in the stacks, and the only way to see the stacks is to look at the stacks.
That's the gap a daily yard count closes. A desk can usually sketch the rough shape of a Golden Week shutdown without much help. What it can't sketch from a calendar is how fast a specific terminal is refilling after the fact, day by day, measured against the same terminal the week before the shutdown and the same week last year. That's the comparison that tells you whether the restart is running ahead of or behind a normal year, and it's the comparison that's missing from a desk working off AIS and a month-old trade release.
We've started building out a running read on container stacks, vessel calls, and anchorage queues at the ports that matter most for this kind of seasonal whipsaw, and the approach is laid out here for anyone pricing capacity around the next one. Golden Week will happen again next October, right on schedule, and the yard will tell you how the restart is actually going well before the paperwork does.