Notes
Container throughput vs retail inventory levels: what the lag tells an analyst
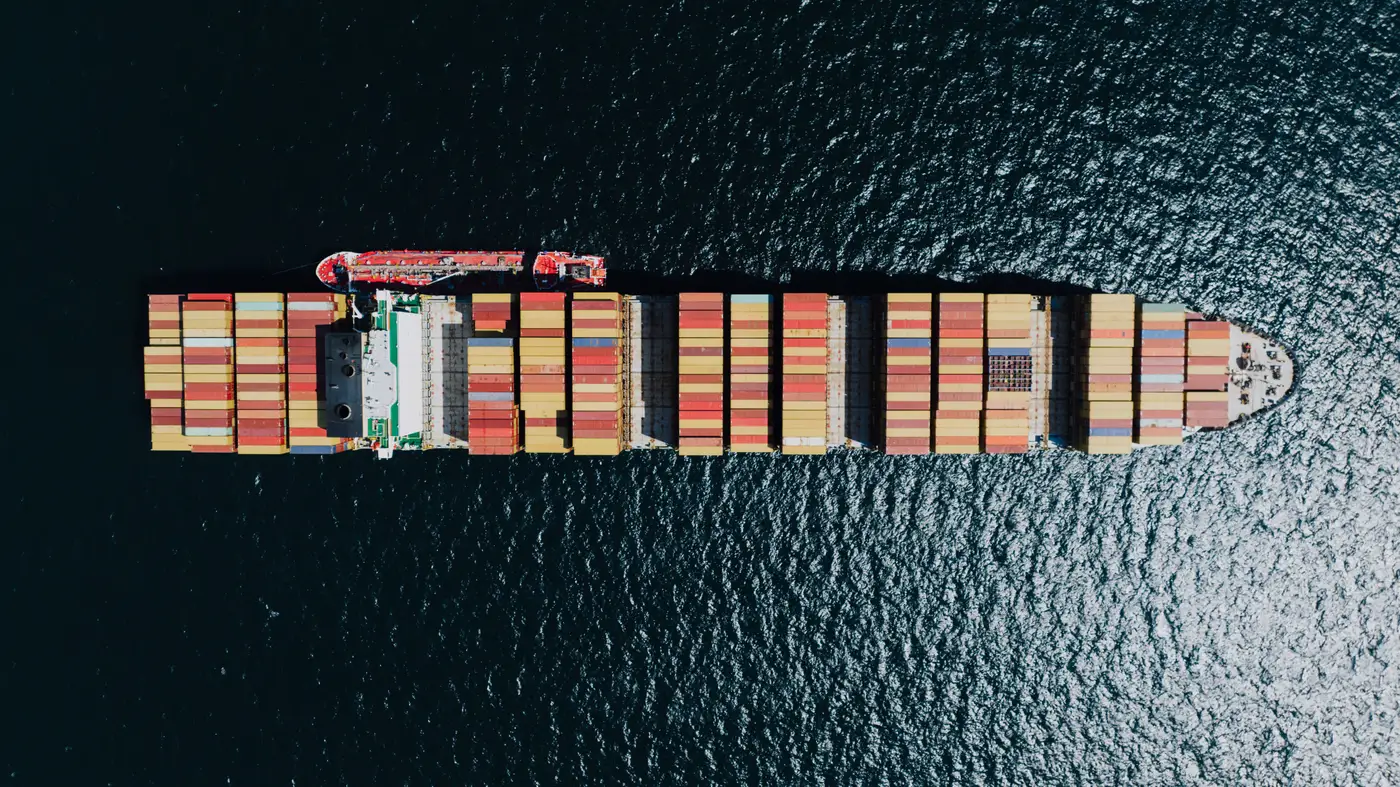
Retail inventory-to-sales data posts monthly, describing a month or more that's already closed. Container throughput at the ports feeding those retailers moves first. That gap is where an analyst actually earns the call.
Why the two series don't move together
A box leaves Yantian or Ningbo, sits on the water for two to three weeks on a transpacific string, clears customs, moves through a rail ramp or drayage yard, and lands in a distribution center before it ever shows up as "inventory" on a retailer's books. By the time Census or a retailer's own inventory-to-sales figures post, the goods they describe already cleared the terminal weeks earlier. Container counts at the port are the leading edge of that chain. Retail inventory is the trailing edge, reported after the fact.
That lag is the whole trade. If vessel calls and container stack counts at a named port are climbing while retailer inventory is still reported flat, goods are in transit toward a restock that hasn't hit the official numbers yet. If stacks are thinning while inventory is still elevated in the latest filing, the destocking cycle is further along than the published data lets on.
Reading the restocking cycle from stack counts
Retailers order against a forecast made weeks before the shipment moves. That forecast, not the sell-through the market eventually sees, is what shows up first at the port, as a vessel call and a stack of containers waiting on drayage, long before it shows up as a line item in a 10-Q or a Census release. Watching container stack counts at the gateway port a given retailer or category depends on, Long Beach for West Coast big-box, Savannah for Southeast apparel, Rotterdam or Antwerp for European consumer goods, gives a read on the restocking cycle closer to the order date than to the sale date.
The practical use: when stack counts at a retailer's primary port turn before the quarter's inventory print, that turn is the leading signal. An analyst waiting for the inventory-to-sales ratio to confirm it is trading on data that's already stale by weeks. A shift in anchorage queues or berth utilization at the same port, days ahead of the stack counts moving, pushes the lead further still.
What the gap actually measures
The throughput-to-inventory lag isn't a fixed number. It depends on origin port, destination port, inland transport mode, and how a given retailer runs its distribution network. But the direction holds steady: throughput moves first, inventory reporting moves second, and the width of that gap is roughly the time it takes a container to go from terminal to shelf-ready stock. For an analyst nowcasting a specific name or sector, the useful exercise is building a daily read on the port side, confirming a long or short call before the inventory data catches up and the move is already priced.
Customs releases and port-authority statistics still matter. They're the numbers everyone else eventually sees, and they anchor the longer trend. The edge sits in the days between a container stack forming at the terminal and that same container turning up as inventory in a filing. A daily count of stacks, vessel calls, and anchorage queues at named ports, built from satellite passes instead of waiting on a monthly release, is what Trade Flow Index tracks.
If the gateway port for the name or sector you're watching is known, that count is worth checking before the next inventory print lands.