Notes
Container throughput vs ISM manufacturing PMI: which one actually leads
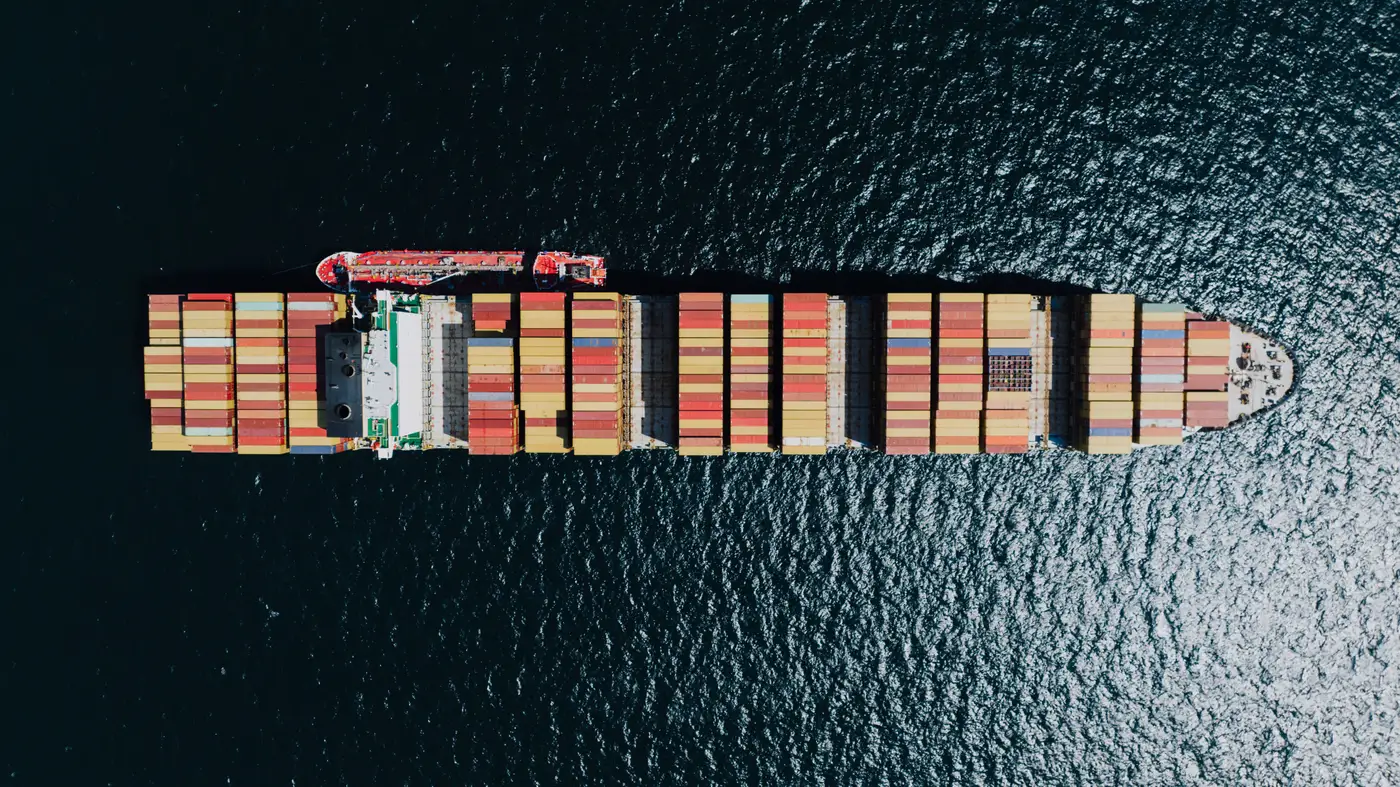
Every few months a desk note goes around asking whether the ISM new export orders index is "leading" or "lagging" the actual volume of freight moving through US ports. It's a reasonable question to ask and a hard one to answer cleanly, because the two series aren't measuring the same thing and don't arrive on the same clock.
What each number is actually counting
ISM manufacturing PMI, and the new export orders subcomponent in particular, is a diffusion index built from a monthly survey of purchasing managers. Respondents report whether export orders are up, down, or flat versus last month, and the index nets that out to a number above or below 50. It tells you sentiment and direction. It does not tell you volume, dollar value, or which lanes are moving. A reading of 48 can come from a broad, modest pullback across hundreds of firms or a sharp drop concentrated in a handful of large exporters, and the headline number looks identical either way.
Container throughput is a count of actual boxes moving across a dock, loaded and discharged, at a named terminal. Port authorities and customs agencies publish it as TEU or lift counts, and it's as close to ground truth on physical trade flow as public data gets. The catch is release timing. Most port authorities post monthly throughput figures four to six weeks after month-end, and US trade statistics from Census and BEA run on a similar lag. By the time either number prints, the freight it describes is already a month or more old.
So which one actually leads
In theory PMI should lead, because it's forward-looking survey language ("orders," not "shipments") and it posts on the first business day of the following month, well ahead of official port data. In practice the lead is unreliable. New export orders is a small, volatile subindex, it gets revised, and it has gone through stretches (2022 into 2023 was one) where the index signaled contraction for months while actual loaded export volume at major gateways held up better than the survey implied. Sentiment can run ahead of or behind the physical flow depending on what purchasing managers are reacting to that month, order books, input costs, inventory destocking, none of which maps cleanly onto what's actually getting loaded onto a vessel.
For a desk, the useful framing is that PMI gives you a soft, early, noisy signal, and official throughput gives you a hard, accurate, slow one. Neither alone gives you a timely, accurate read on what's happening at the dock right now.
Closing the gap between the two
Closing that gap means finding a physical read on throughput that posts faster than the official release, something that sits between the survey and the customs data rather than asking you to pick one. Daily satellite passes over port terminals can count container stacks, vessel calls at berth, and anchorage queue length well before port authorities compile and publish a monthly figure, which gives you something to check the PMI new export orders print against in near real time instead of waiting a month to find out if the survey was right. Trade Flow Index builds that series, a daily count of stacks, calls, and queues at named ports, so you aren't stuck choosing between a sentiment survey and a lagging official number.
If you're building an industrial production nowcast or just trying to get ahead of the next trade data release, run the PMI export orders print against a daily physical count instead of waiting on it alone.