Notes
Container freight rates vs vessel call volume: why the two diverge
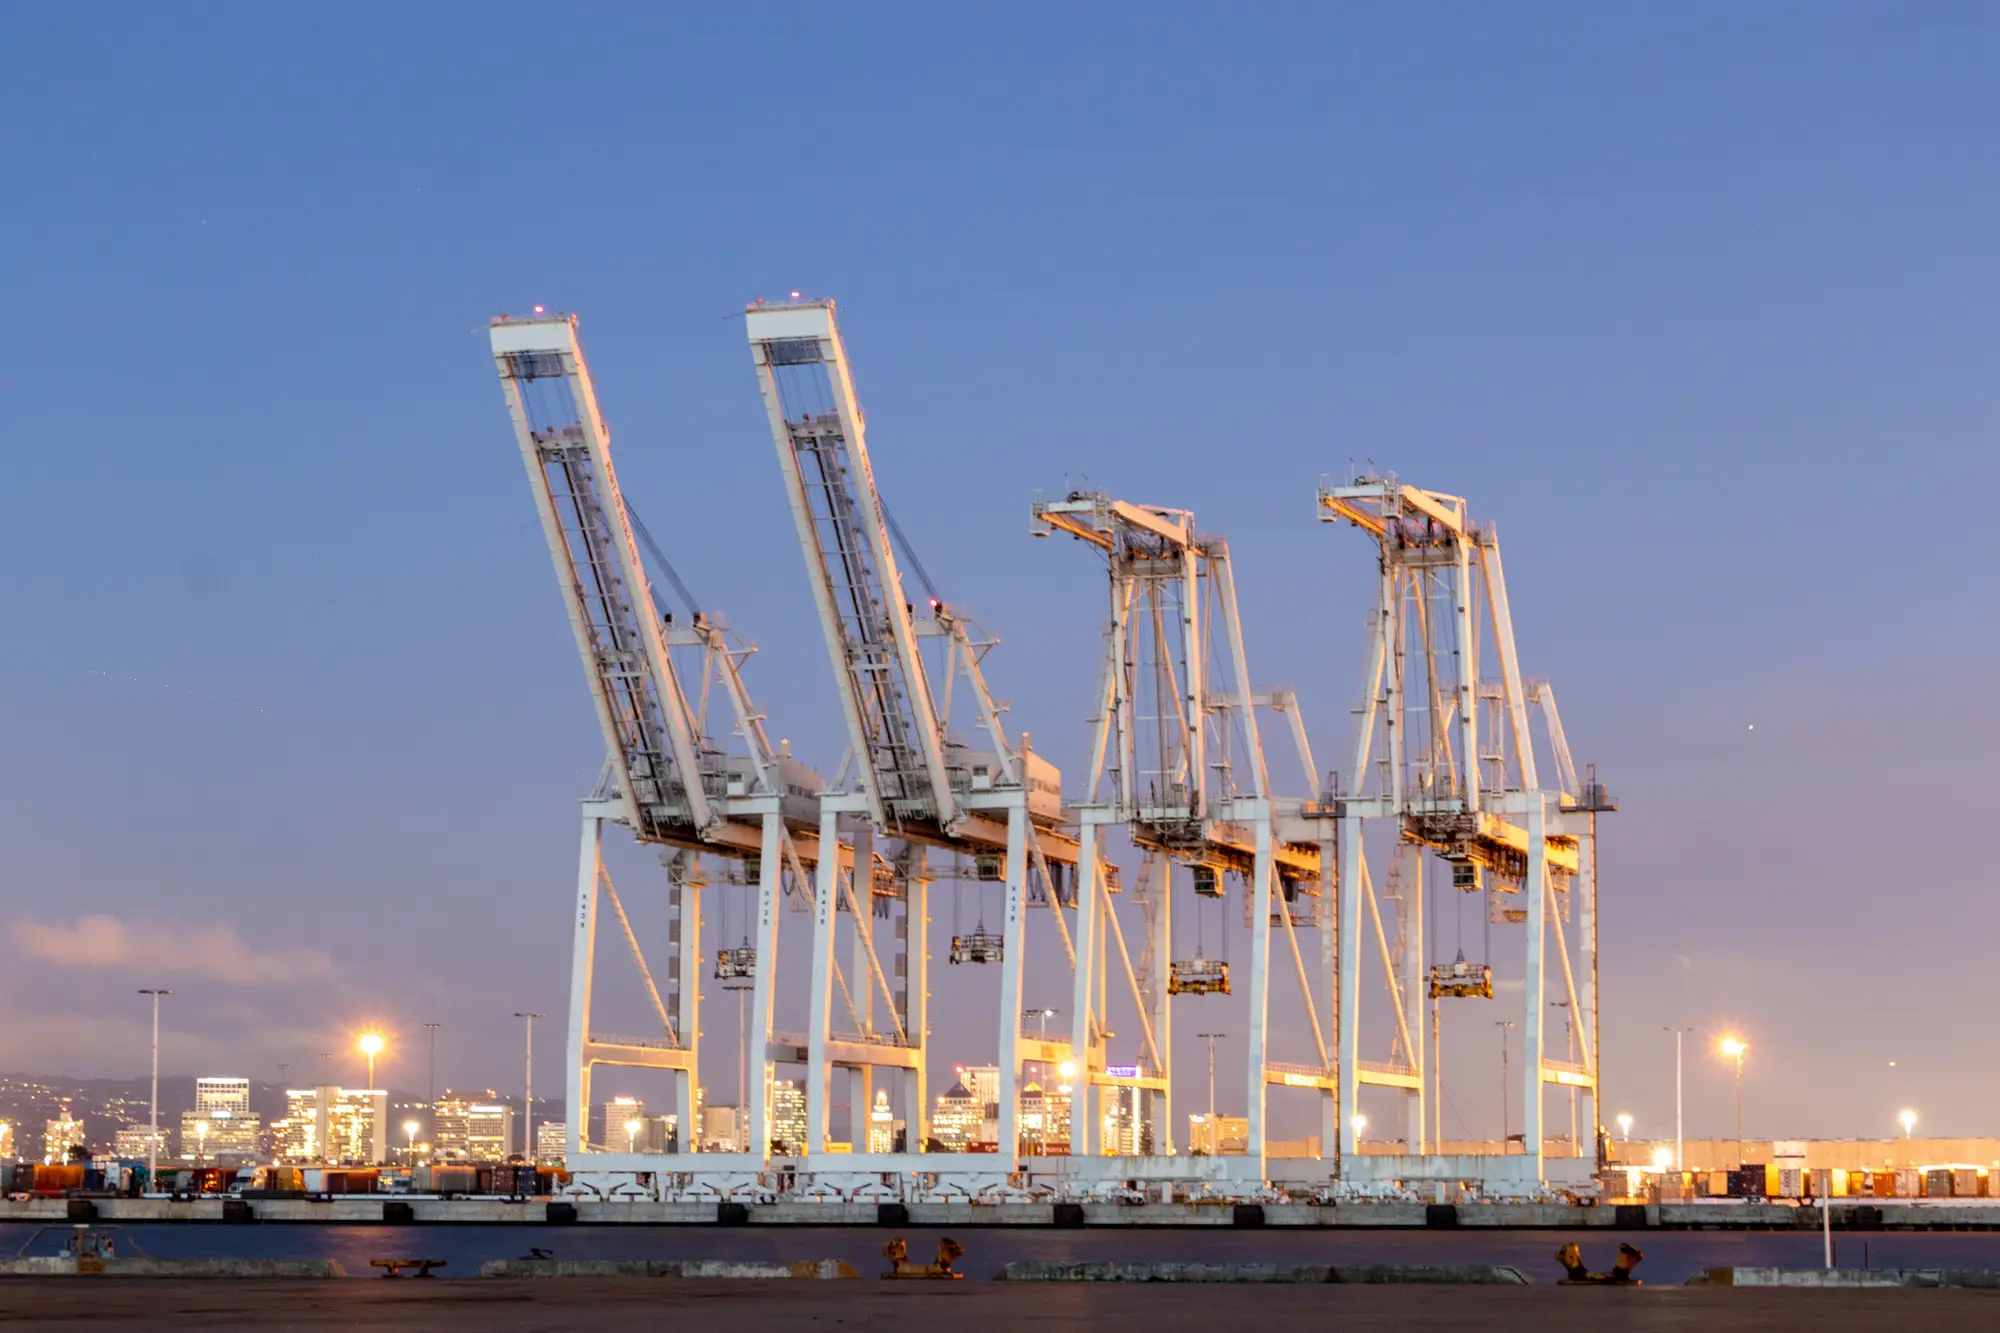
A desk that watches the Shanghai Containerized Freight Index every week eventually asks the same question: if rates are falling, why are vessel calls at the big transpacific ports still steady, or even climbing? The two numbers feel like they should track each other. They don't, and the reason comes down to what each one measures.
Two different signals, not one
Spot freight rates price marginal capacity on a trade lane this week. Vessel call volume counts ships that arrived at a berth this week. A rate index reacts to booking behavior almost instantly, since carriers reprice open slots daily on some lanes. A port's call count reflects decisions made four to six weeks earlier, when those ships left Asia. By the time a vessel ties up at Long Beach or Rotterdam, the freight contract that filled its boxes is old news.
That lag alone explains a lot of the apparent disconnect. Rates can fall hard in week one because carriers see soft forward bookings, while call volume stays flat because the ships already loaded and sailed before that softness showed up. The divergence is two clocks running at different speeds on the same trade.
What moves spot rates
Spot pricing responds to short-run supply of available slots relative to cargo on offer. Carriers manage that supply through blank sailings, voiding a scheduled port call entirely, well before the ship would have arrived. A string that blanks three of twelve weekly sailings pulls capacity out fast and rates respond within days. None of that shows up as a change in calls at the destination port, because the blanked sailing was never going to call there in the first place. It shows up as an absence, and absences are hard to count from trade data that only reports what landed.
Bunker surcharges, alliance network shuffles, and contract-season resets (the big ones land in May and around Lunar New Year) also move spot indices without touching how many ships physically show up at a given terminal that week.
What moves call volume
Call counts at a named port respond to a different set of forces: terminal congestion upstream, berth window availability, and how carriers are sequencing a string across multiple ports to recover from a delay. A port can see a surge in calls simply because two weeks of blanked sailings get un-blanked at once and three ships arrive back to back. Rates, meanwhile, may have already recovered or kept falling on an entirely separate timeline tied to booking demand six weeks out.
Anchorage queues add another wrinkle. A port with ships stacking up outside the breakwater is showing strong arrival pressure even while spot rates on that lane are soft. The queue runs on its own calendar, reflecting cargo that was booked weeks earlier.
Reading the gap instead of ignoring it
Treating freight rates and call volume as one combined "demand" number flattens a distinction worth keeping. Rates tell a desk what shippers are willing to pay this week. Call volume, read at the terminal level with enough history behind it, tells a desk what already left port and is about to hit customs clearance and inventory counts. The two series lead different things: rates lead near-term carrier revenue, call volume and anchorage behavior lead the throughput numbers that eventually show up in trade statistics and GDP trade-balance components.
A desk that only watches rate indices is flying blind on the physical side of the trade for weeks at a stretch. This is the gap a daily count of vessel calls, container stack density, and anchorage queues at named ports is built to close, which is the whole premise behind Trade Flow Index: a way to see throughput building or stalling before the official releases catch up to it.
If your rate feed and your gut are telling you different stories about a lane, that's usually the moment to go look at what's actually sitting at the berth.